Four days of LIFL-11 transects across Goczałkowice Reservoir in southern Poland, 16 to 19 June 2026, with the University of Warsaw and the University of Silesia, recording chlorophyll-a and CDOM fluorescence as ratios to the water Raman line
Preliminary figures
Interpolated campaign fields from the team's first processing pass, before calibration and review; values may change.
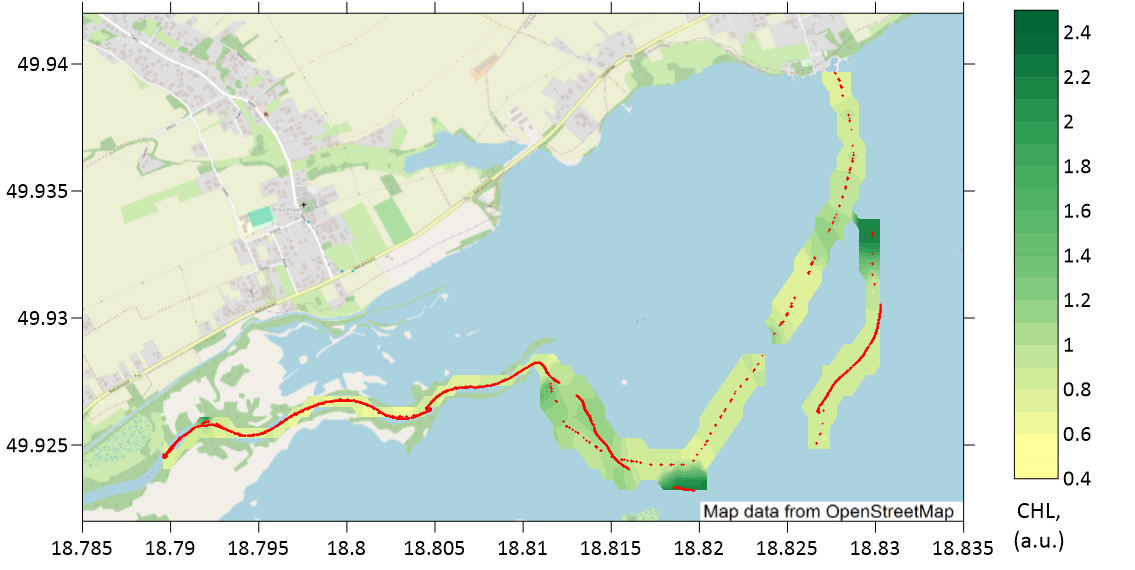
Fig. 7Measurement record, 16 June 2026. 4,310 lidar returns are plotted along the vessel track
for Chl-a. The field view applies
inverse-distance weighting to the same observations; the shoreline is from OpenStreetMap.
Fig. 8Measurement record, 17 June 2026. 6,920 lidar returns are plotted along the vessel track
for Chl-a. The field view applies
inverse-distance weighting to the same observations; the shoreline is from OpenStreetMap.
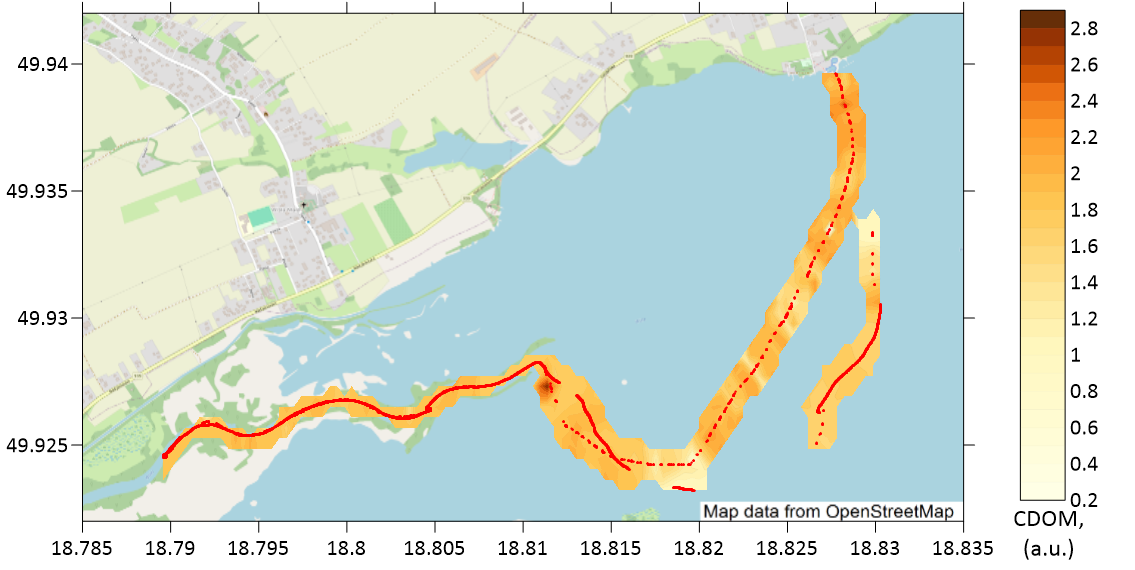
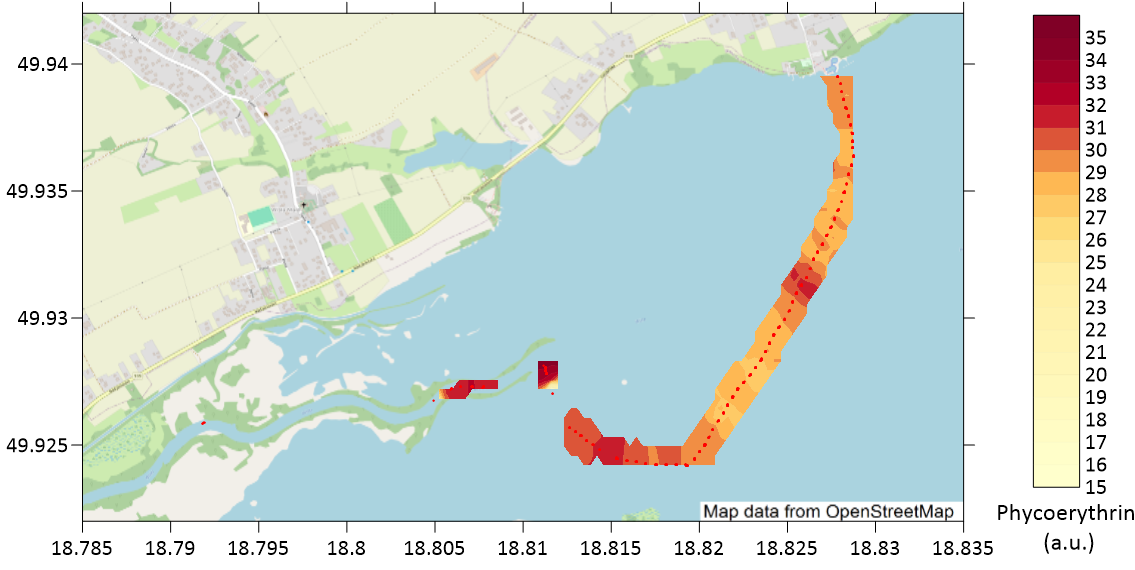
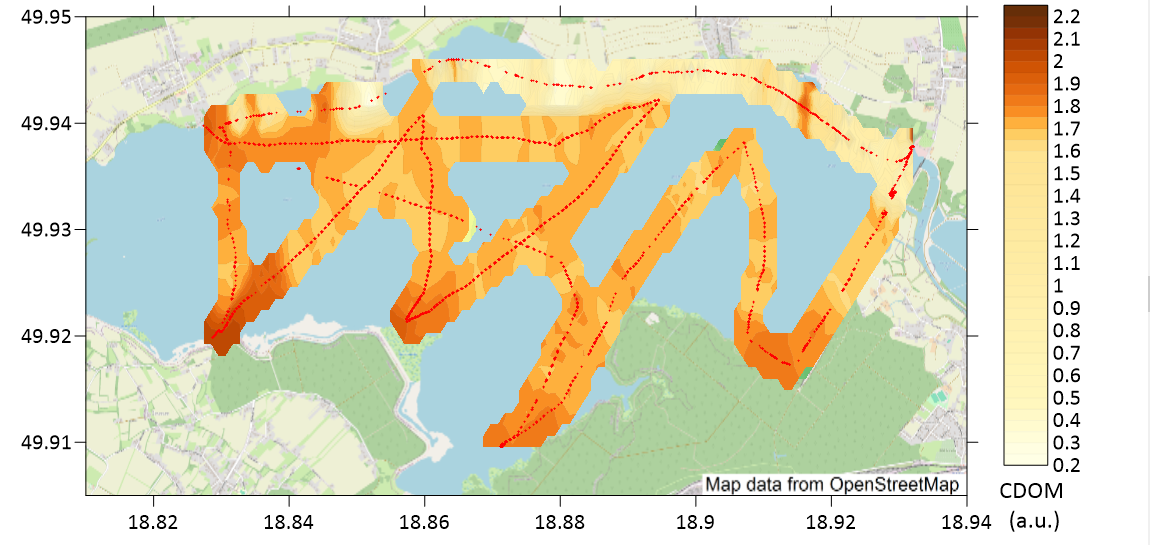
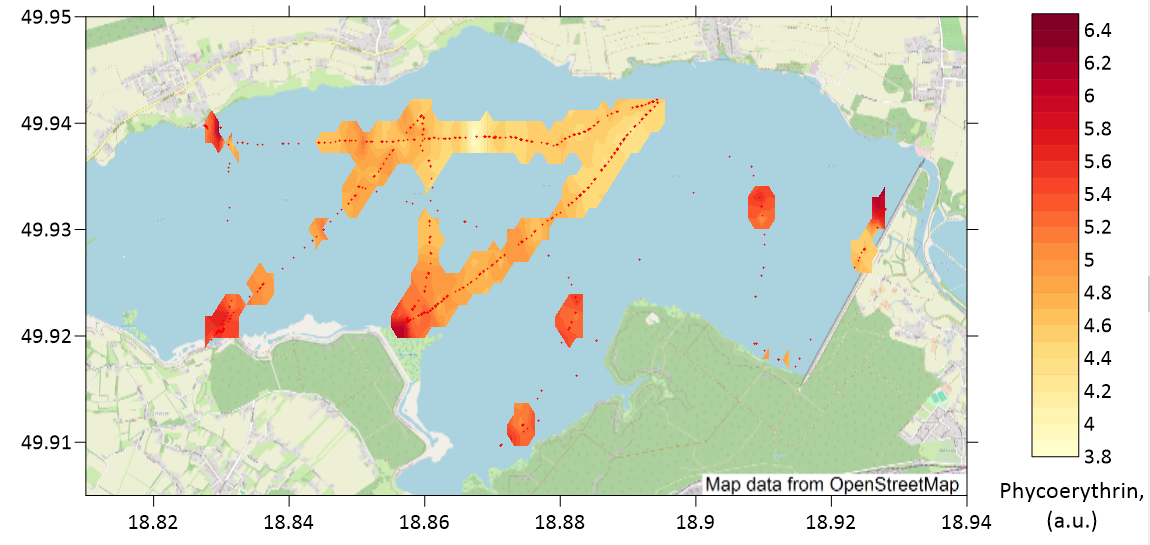
Fig. 9Measurement record, 18 June 2026. 83,841 lidar returns are plotted along the vessel track
for Chl-a, CDOM. The field view applies
inverse-distance weighting to the same observations; the shoreline is from OpenStreetMap.
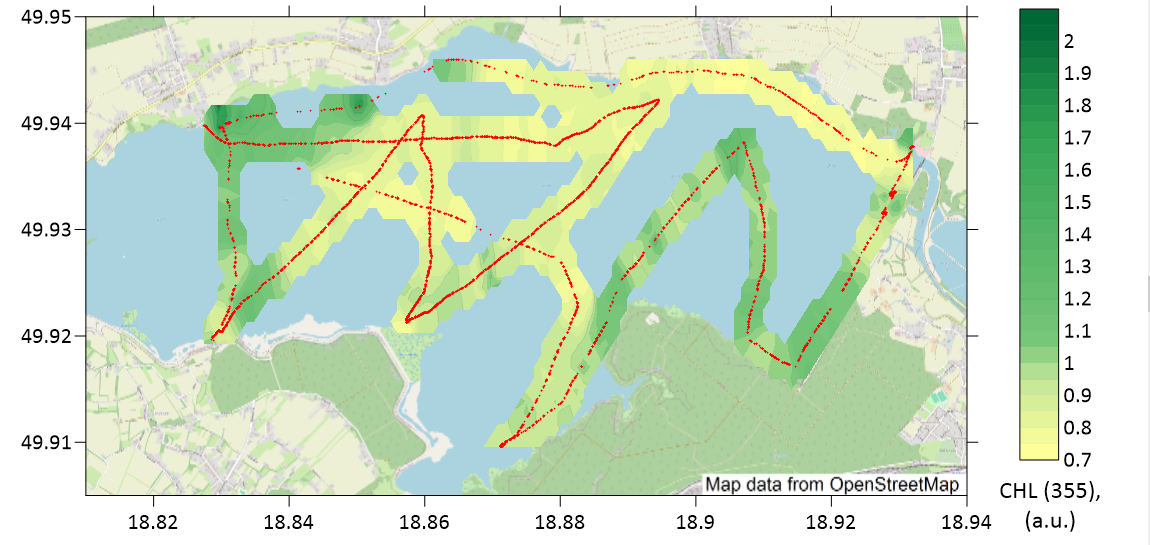
Fig. 10Measurement record, 19 June 2026. 9,569 lidar returns are plotted along the vessel track
for Chl-a. The field view applies
inverse-distance weighting to the same observations; the shoreline is from OpenStreetMap.
From 16 to 19 June 2026 the LIFL-11 surveyed Goczałkowice Reservoir, the Vistula impoundment that supplies drinking water to the Upper Silesian conurbation, with teams from the University of Warsaw and the University of Silesia in Katowice. Two mFL-12 lidars and the mHR-2 radiometer ran beside it, and conventional samples and two towed buoys were taken along the same track.
The first two days covered the western and eastern halves in turn, the 18th ran the full length of the reservoir in one eight-hour pass, and the 19th closed with an hour over the central basin in the evening, after a morning on Farskie Lake near Gliwice. Chlorophyll-a and CDOM fluorescence are each expressed as a ratio to the water Raman line at 404 nm. On the 18th the CDOM ratio was highest at the western end, where the Vistula enters, with a median of 1.9 against 1.5 in the east, and the chlorophyll-a ratio rose through the week from a median of 0.83 on the 16th to 2.5 on the evening of the 19th.